Archive
Peak Performance: The Math of Sports
Sports have manifested in all cultures throughout recorded history. Sports pit man vs. man, man vs. machine and man vs. himself. As sports games and activities unfold, a variety of opportunities emerge to apply math principles. Very simple math can help us answer such questions as “how fast?”, “how often?” and “how many?”
Basic Concepts
- Units of Measure
- We measure distances in units like feet and meters and time in units like seconds and minutes. This information helps us understand scale and scope of a numerical value.
- For example: I walked 50 meters or I waited for 30 minutes.
- Average
- Also called the arithmetic mean, an average is a simple statistic that gives a general idea of where a set of values are centered.
- For example, the height of the average man in the US is 5’10”. Some people will be taller and some shorter but many adult males will be about 5′ 10″ in the US.
The World’s Fastest Man
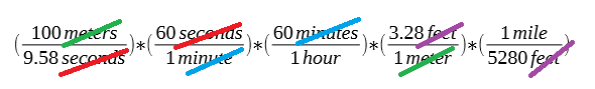
Usain Bolt of Jamaica has demonstrated amazing athletic ability in the sprint events of track and field. One memorable event featured in the video is a world record 9.58 second performance in the 100 meter dash. You can watch the video and get a sense of how his performance compares to other world class athletes, but it is hard to get a sense of how fast this actually is. Perhaps we could transform the units of meters/second to something more familiar like miles/hour.
To do that we will need to do a process called unit conversions. A few facts will help in our conversion calculation:
- 60 seconds = 1 minute
- 60 minutes = 1 hour
- 3.2 feet = 1 meter
- 1 mile = 5280 feet
Note that we can move the right side to the left or the left side to the right and the value of the fraction will be the same (e.g. a form of one). The calculation to convert the unit looks like so:

We can cancel out units of the same type. We show cancellation by putting a line through the unit. For clarity we made the color for each unit unique. Cancellation looks like so:
After cancellation the computation looks like:

Completing this calculation we can see that Usain bolt covered as much ground in 9.58 seconds as a car traveling at 23.3 miles/hour would cover. This means that in some jurisdictions, Mr. Bolt runs so fast he could get a speeding ticket in a school zone!

Going the Distance
A race for Usain Bolt is over before you can finish a commercial. How about distance runners? What type of speed can long distance athletes achieve? For this question we will consider the athletic feats of Bennisa Bekele of Ethiopia. Mr. Bekele is the world record holder in the 10,000 meter race with a time of 26:17.53.
We can do the same type of calculation we did for Mr. Bolt’s race to determine a speed in miles per hour. We’ll go a little faster since we have already covered the calculation in detail.
First, let’s express 26:17.53 in seconds. There are 1560 seconds in 26 minutes. That gives us 1577.53 seconds in 26:17.53
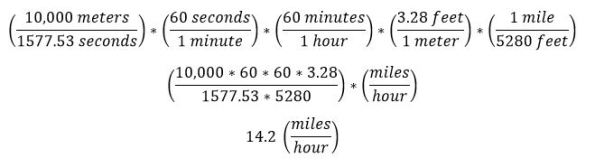
With this number we can see that a distance runner has about a 40% drop in speed but a 100x increase in distance. Even with this information, one may still not be able to appreciate just how fast this world record holder is going. A more common way to think of pacing in the time to complete one mile. For example a student in a exercise class might record a “mile time” that they would improve upon during a year. In terms of units this means we want time/distance, or specifically seconds per mile. This means we want the inverse of the value we calculated.
The calculation changes to:

This means the world record holder has nearly a 4 minute mile pace for the duration of the race. Bennisa Bekele can run a full mile in just about the time it takes to boil an egg.
With some simple math we can transform sports outcomes into familiar units of measurement.
The Sultan of Swat
The pace and flow of baseball allow ample opportunities to capture a wide variety of statistics. One of baseball’s most famous players was Babe Ruth. Dubbed the “Great Bambino” and “The Sultan of Swat”, Ruth had a storied career of ups and downs that included many championships and records that are still in place.

Of the many statistics gathered in baseball, a batting average is a common measure of how skilled a batter is at connecting with the ball. A batting average is calculated by dividing the number of hits by the the number of at bats or attempts by a player. The batting average represents the probability or chance that a hitter will connect when they face a pitcher.
Babe Ruth had 8,399 at bats over his 22 year career. Of those at bats, he had 2,873 hits. With these numbers we can calculate his batting average over his entire career as (2,873 hits)/(8,399 at bats). This means Ruth had a batting average of .342. Now if a student came home from school and presented a grade of 34.2%, they would surely be scolded by their parents. But in the game of baseball, where it is pitcher vs. batter and there are a myriad of choices playing out each moment, connecting 34.2% of the time is pretty remarkable. This can be approximated to say that Ruth got a hit every three times he made an attempt.
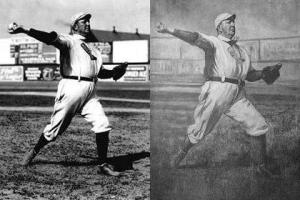
The Cyclone
Another great player in baseball history was Cy Young. Cy was short for “Cyclone, which was a nick name given to Young during his first try out as a professional baseball player. The speed of his fastball had damaged the grandstands to the point that it looked like a cyclone had occurred. The Cyclone name stuck and Cy Young went on to have a long career as a pitcher. Cy Young established many records, some of which still exist today. Cy Young’s name was given to an award that recognizes pitching excellence in Major League Baseball.
While hitters are measured by how many times they can connect with a pitch, pitchers are measured by how few runs they allow. This statistic is called an earned run average or ERA. Like a score in golf, a player aims to have a low ERA. A lower ERA means fewer runs are scored while a pitcher plays. The ERA as a statistic is calculated by taking the proportion of runs allowed to innings pitched multiplied by nine. This scaling to a full game of nine innings makes it possible to compare pitchers who may pitch a variable amount of innings over each game in a season.
Over the 22 years that Cy Young played, he pitched 7,356 innings. In those innings a total of 2,147 runs were earned. The value of 2,147/7,356 can be scaled by 9 to give a career ERA of 2.63. While there have been pitchers with lower career ERAs, no one can match the number of inning pitched by Young.
Using simple math we can get an idea of the long term performance of these legends and appreciate their accomplishments.
Counting Games
Counting is learned at such an early age that we may not even think of it when we think of “math”. But counting plays a key role in score keeping for a variety of sports. Games with variable scoring events introduce a element of strategy to optimize efforts for the best reward. While this can be an important or even interesting part of a game like basketball or football, score optimization can also have startling outcomes when it is applied to tournament play.
Many sports have tournament style play where advancement depends on the outcome of a number or games played within a small group. For example, the world cup has pool play that determines how the rest of the tournament unfolds. Tournament organizers must however be careful with how they structure tournament scoring. It is possible to create a scenario where the best long term outcome is to LOSE in the short term. This may sound confusing, isn’t the point of playing a game to WIN? How would losing offer any kind of advantage?
This very scenario played out in great prominence during the London 2012 Olympics in the sport of Badminton. Several team had already secured positions in the next round and winners would face higher ranked players sooner in the knockout rounds. Since teams wanted to be more likely to advance to a medal round, they attempted to lose on purpose to secure an easier match up. The full details are included in the references. The ethics of losing on purpose is sure to be a topic that will be debated for years to come.
Even a simple math principle like counting plays a key role in selecting a strategy for a given game.
Conclusion
Ultimately, success in sports is determined by time spent in the weight room and on the field playing. We can however use math to appreciate and understand sports in greater depth.
References
- Babe Ruth Career Statistics http://www.baseball-almanac.com/players/player.php?p=ruthba01
- Cy Young Player Career Statistics http://www.baseball-almanac.com/players/player.php?p=youngcy01
- CNN Coverage on Badminton Controversy http://www.cnn.com/2012/08/01/sport/olympics-badminton-scandal/
- Yahoo Sports Article on Badminton Controversy http://sports.yahoo.com/news/olympics–badminton-tournament-marred-by-teams-trying-to-purposefully-lose-a-match.html
Videos
Castles in the Desert: Games of Chance and Math
Introduction


Casinos represent a mind boggling concentration of resources. It is not uncommon for casinos to be vast structures with hundreds of employees, restaurants, shopping , hotels, lavish finishes, advanced technology and extensive areas for gambling activities. All of these things are concentrated in the most unlikely of places, in a desert landscape where the blazing sun is plentiful and water is sparse. Under normal circumstances populations grow around areas high in resources like places where food can grow easily or that have access to large bodies of water. The casino hubs though, especially those in arid places like Nevada, grew because the business of gambling is extremely lucrative. The business is so lucrative that these companies can even build modern day castles in the desert.
The House Always Wins
The first thing to consider when looking at the math of gambling is the idea that the house always wins. The house, or the establishment that hosts the gambling activities, does not win every bet. There are times where individuals win both small and large sums of money. What we mean by the house always wins is that in the long term, over many, many betting transactions, the house is mathematically destined to win. For each winner there are many more losers. If the house always wins in the long run, you might ask: How often does the house win and by how much?
We’ll use a few concepts from an area of math called probability to gain an idea on how to answer that question. We’ll just scratch the surface, but it will give you an idea on how to learn more.
Basic Concepts
- Randomness
- Things happen without an order or predictable pattern
- Experiment
- An experiment is when we do a random act to get an outcome. So we might roll a dice to see which number appears.
- Event
- The result of an experiment. In the dice rolling example we might roll a three.
- Sample Space
- All of the possible outcomes or events. A cube shaped dice has six possible outcomes.
- Probability
- The chance something will happen. Usually expressed as a fraction. The probability of all events in a sample space adds up to 1. I have a one in six chance that a three will be rolled on a dice
- Independent Events
- Events are independent if they do not influence one another. Each time I roll a dice it does not matter what has been rolled before.
- Dependent Events
- Events are dependent if they influence one another. If I draw a card and do not replace it in the deck, then I can’t draw that card again. Specifically, if I had 10 cards and removed one, the next time I drew a card there would only be nine cards to choose from.
One Dice
Let’s think about one dice. How many ways are there to roll the dice? A cube has 6 sides so there are six ways to roll one dice.

Two Dice
What about if we roll two dice? Well there are 6 ways to roll the first dice and six ways to roll the second. The first conceptual challenge here is how do we count the events in the sample space? It is always easier to use real numbers so let’s consider that we roll 1 on the first dice. How many ways can the second dice be rolled? (6) We can repeat the thought experiment by rolling a 2 first, then a three first etc. We get something that looks like 6+6+6+6+6+6 or 6*6. We can also visualize this by organizing the outcomes in a table.

We can go further and look at how many times each sum appears in the table. We can use this information to determine the probability for each sum. For example a sum of two can be formed exactly one way (by rolling two ones) in all 36 combinations. Therefore the probability of the dice adding up to 2 is 1/36. The full distribution looks like this:

Craps
Craps is a gambling game where participants place bets on the results of rolling two dice. The rules of the game are as follows:
- The player (known as the shooter) rolls a pair of fair dice
- If the sum is 7 or 11 on the first throw, the shooter wins; this event is called a natural.
- If the sum is 2, 3, or 12 on the first throw, the shooter loses; this event is called craps.
- If the sum is 4, 5, 6, 8, 9, or 10 on the first throw, this number becomes the shooter’s point. The shooter continues rolling the dice until either she rolls the point again (in which case she wins) or rolls a 7 (in which case she loses).
There are a wide variety of bets that relate to these activities. The purpose of this article is not to encourage gambling or explain the intricacies of the activity so we’ll only scratch the surface of this game. In fact the goal of this article is to help you understand how much a gambler can stand to lose in the long run.
Consider the case of winning on the first throw. There are 6 ways to roll a seven and two ways to roll an eleven. This means there are eight ways out of 36 to have a winning outcome. We can pair this information with two related bets on this outcome
The seven bet pays out 4:1. So if a dollar is bet, the player nets $4 otherwise he loses his dollar. The gambler will win one in six tries in the long run or 16.7% of the time. So if the gambler places 1,000 one dollar bets he will win back $668 (167 * $4). However he will lose $833 (833 * $1) This means over the long run he walks out $165 poorer.
The eleven bet pays out 15:1. So if a dollar is bet, the player nets $15 otherwise he loses his dollar. Similar to the 7 bet calculation , the player has a 5.6% chance of an 11 bet succeeding. If he places 1,000 one dollar bets, he will win back $840 (56 * $15) and lose $944 (944 * $1). The means over the long run he walks out $104 poorer.
In both of the previous cases the house was the long term winner. Even though the player may feel like they are winning at some points in time, over many betting cycles the house amasses a large influx of cash. The house’s winnings are always net positive in the long run and the player’s are always net negative.
We can use the simulator in the references below to gather the long term results of all craps bet types for our 1,000 one dollar bet scenario. Any way you go you will walk out poorer over the long run.

Further analysis can be done on other games of chance. The outcomes are similar with the house winning in all scenarios over the long run. Some games like Black Jack provide the house a smaller edge allowing for skilled players to reap rewards. One can even observe the flow of the game and use probability to make large bets when the hands left in the deck are in the player’s favor. This is a method called card counting. This can be multiplied by having multiple players gathering information on the deck. However this practice, known as team play, is prohibited and casinos will quickly escort out or take action against players found doing it.
Just such a scenario went down when a group of MIT students devised a plan to do team play against single deck Black Jack and reap huge winnings. Their exploits are detailed in the book “Bringing Down the House”. Casinos quickly caught on to their tactics and black listed them from playing. Outside of the US the young students faced threats of physical violence when they tried to employ their tactics.
While one could argue that individuals who counted solo without the help of a team were just being good players and mastering the game, the casinos were not in the business of losing money. They quickly adjusted their games of chance to include multiple decks. This nullified the counting advantages that single decks offered. Building castles in the desert is an expensive venture and the house is going to do everything in their power to ensure that they keep winning in the long run.
So the next time you see a grand structure where there would normally not be one, think a little about why resources are concentrating there. Math is a tool that can help you solve this riddle.
Handouts
- All Possible Outcomes of Rolling Two Dice
- Probability Distribution of Rolling Two Dice
References
- Probability, Mathematical Statistics, Stochastic Processes, Chapter 12: Games of Chance, University of Alabama Huntsville, http://www.math.uah.edu/stat/games/
- Math of the Game of Craps
- Bringing Down the House: The Inside Story of Six M.I.T. Students Who Took Vegas for Millions http://www.amazon.com/Bringing-Down-House-Students-Millions/dp/B001AQY05Y
Videos
